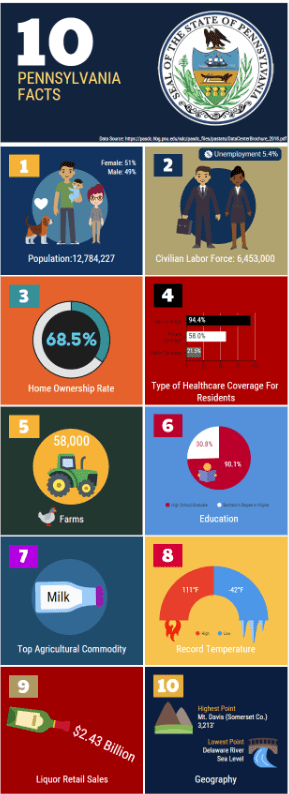
| For the Infographic assignment, I chose to create a list style infographic using data compiled from the US. Census website. I chose this artifact as an example of how I could successfully visualize data. From a design standpoint, I used Venngage to incorporate royalty free graphics, charts, and interesting data that visually displayed Pennsylvania census information. The infographic created supports the PDE Standard I.D. Research, problem-solving and product development of technological applications because I designed and published an online Infographic that visually presented data.
The experience of creating an infographic was different than the previous projects I have been assigned to the Instructional Technology master’s program. Personally, I found the assignment challenging to analyze data and to think about how to creatively show it in a visual format. The experience has been a great growth opportunity for me professionally. I plan to take survey data to create infographics for managers in my department. I feel that creating an infographic is an effective way to tell a story.
My target audience for the infographic was high school students. I have no way of knowing the benefit to high school students since I’m not a teacher. I’m a learning professional in a corporate university so, I showed my infographic to my boss, colleagues, wife, and brothers. They all found the infographic informative and told me they learned new facts about Pennsylvania. They liked the list format and felt like they could interpret the information easily. |